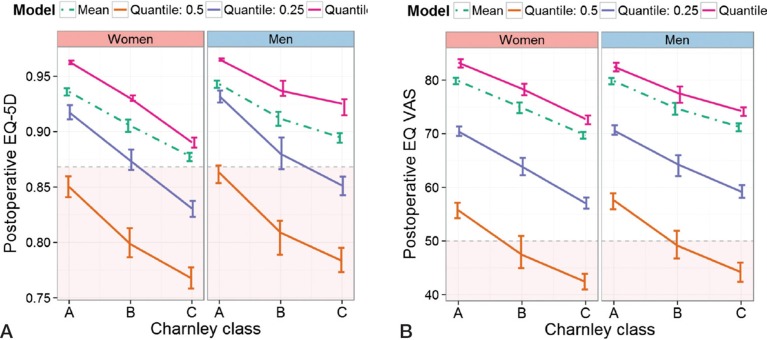
Figure 1.
A. An illustration of the difference in impact of Charnley class depending on sex. The results were adjusted to the median age and pain VAS: 69 years and 65 mm. The most frequent EQ-5D index value preoperatively was 0.87. The red area indicates values below the preoperative index value. The dashed line indicates the predictions from a linear regression model while the solid lines depict quantile regression predictions at the different quantiles. B. The same as in panel A but with EQ VAS as outcome. This was adjusted to the most frequent EQ VAS value preoperatively: 50 mm.

