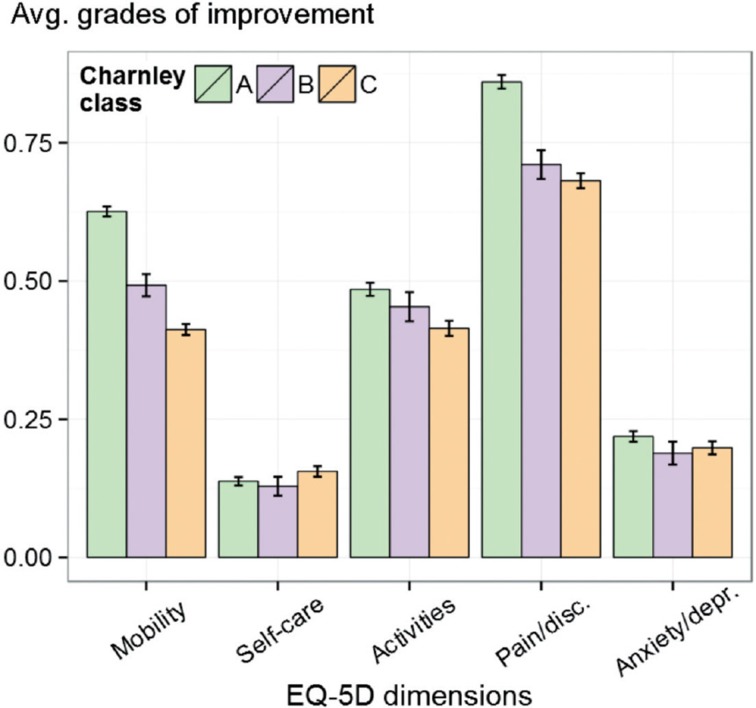
Figure 2.
Average change before and after surgery, by EQ-5D dimension (mobility, self-care, activities, pain/discomfort, and anxiety/depression), each stratified by Charnley class. Each dimension may take on 3 different ordered values; thus, the change ranges from –2 to 2 and this average is shown on the y-axis. The confidence interval bars indicate 95% certainty of each average. The maximum influence of the Charnley classes was on the mobility and pain/discomfort dimensions.

