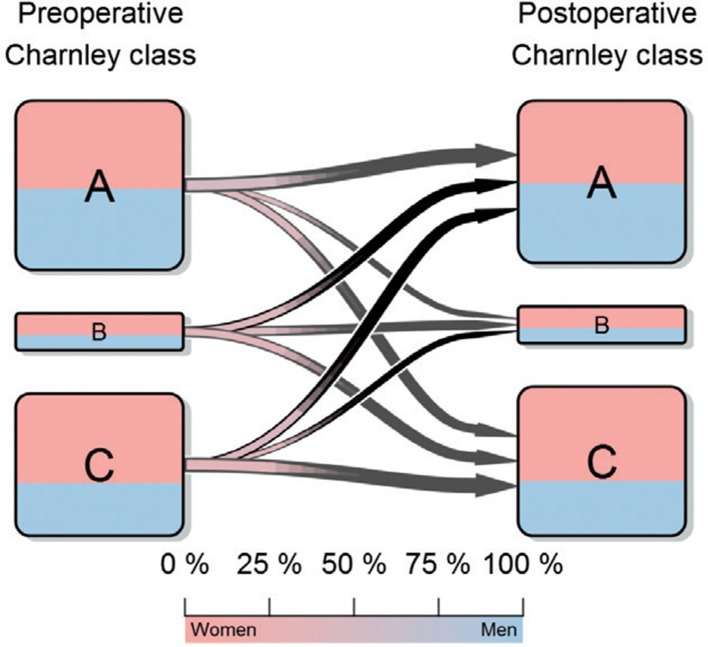
Figure 3.
The crossover between Charnley classes from before to after surgery. The patients before surgery are represented on the left while those after surgery are represented on the right. Pink corresponds to the proportion of women in each group while blue corresponds to the proportion of men. The size of the arrow is proportional to the percentage of patients leaving that specific class and the color of the gradient corresponds to the sex proportion for each transition according to the color bar.

