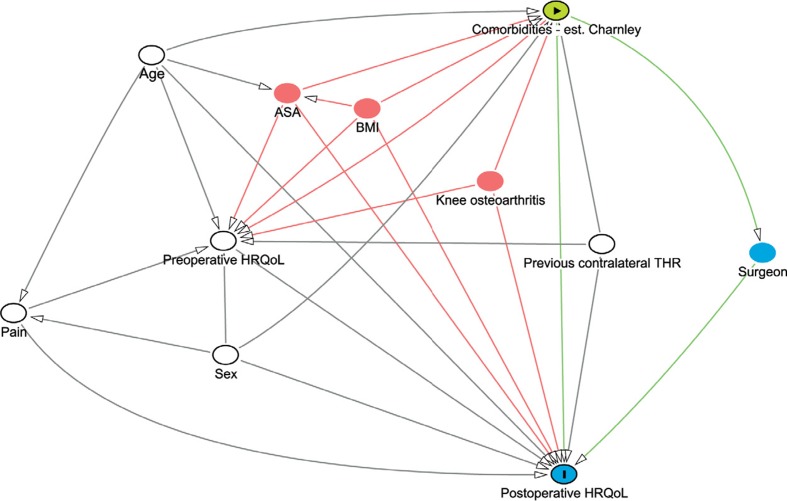
Figure 4.
Our directed acyclic graph (DAG) for this study as generated by dagitty.net. The green node indicates the exposure of interest, the green lines the exposures effect pathways, and the blue node with the “I” indicates the outcome of interest. The blue node without “I” is an intermediate to the effect pathway. White nodes are confounders that are adjusted for in the models, while red nodes indicate nodes that should be adjusted for but that are not available.

