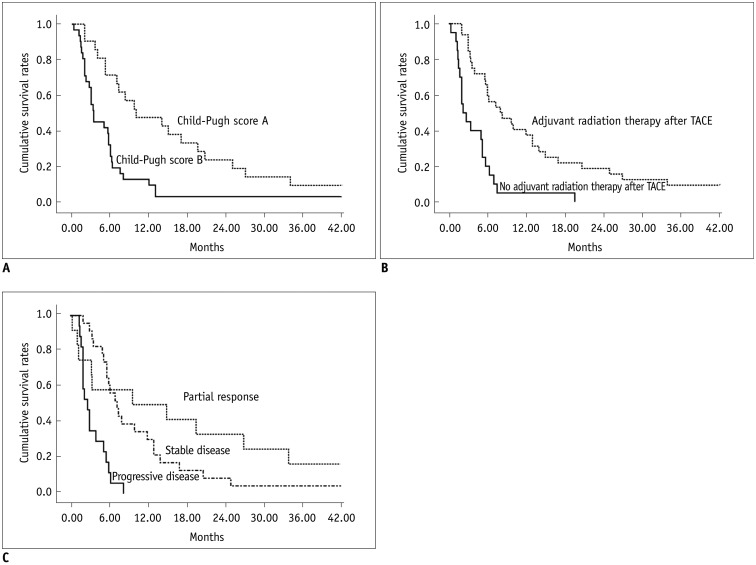
Fig. 3.
Kaplan-Meier analysis for factors associated with patient survival.
A. Kaplan-Meier curves show patient survival rates according to Child-Pugh classification. Median survival period was 10.0 months for patients with Child-Pugh class disease and 3.4 months for patients with Child-Pugh class B disease (p = 0.001). B. Kaplan-Meier curves show patient survival rates according to adjuvant radiation therapy performed after TACE. Median survival period was 8.0 months for patients who underwent adjuvant radiation therapy after TACE and 2.2 months for patients who did not undergo adjuvant radiation therapy after TACE (p < 0.001). C. Kaplan-Meier curves show patient survival rates according to tumor response. Median survival period was 9.7 months for patients with partial response, 7.3 months for patients with stable disease and 2.7 months for patients with progressive disease (p < 0.001). TACE = transcatheter arterial chemoembolization

