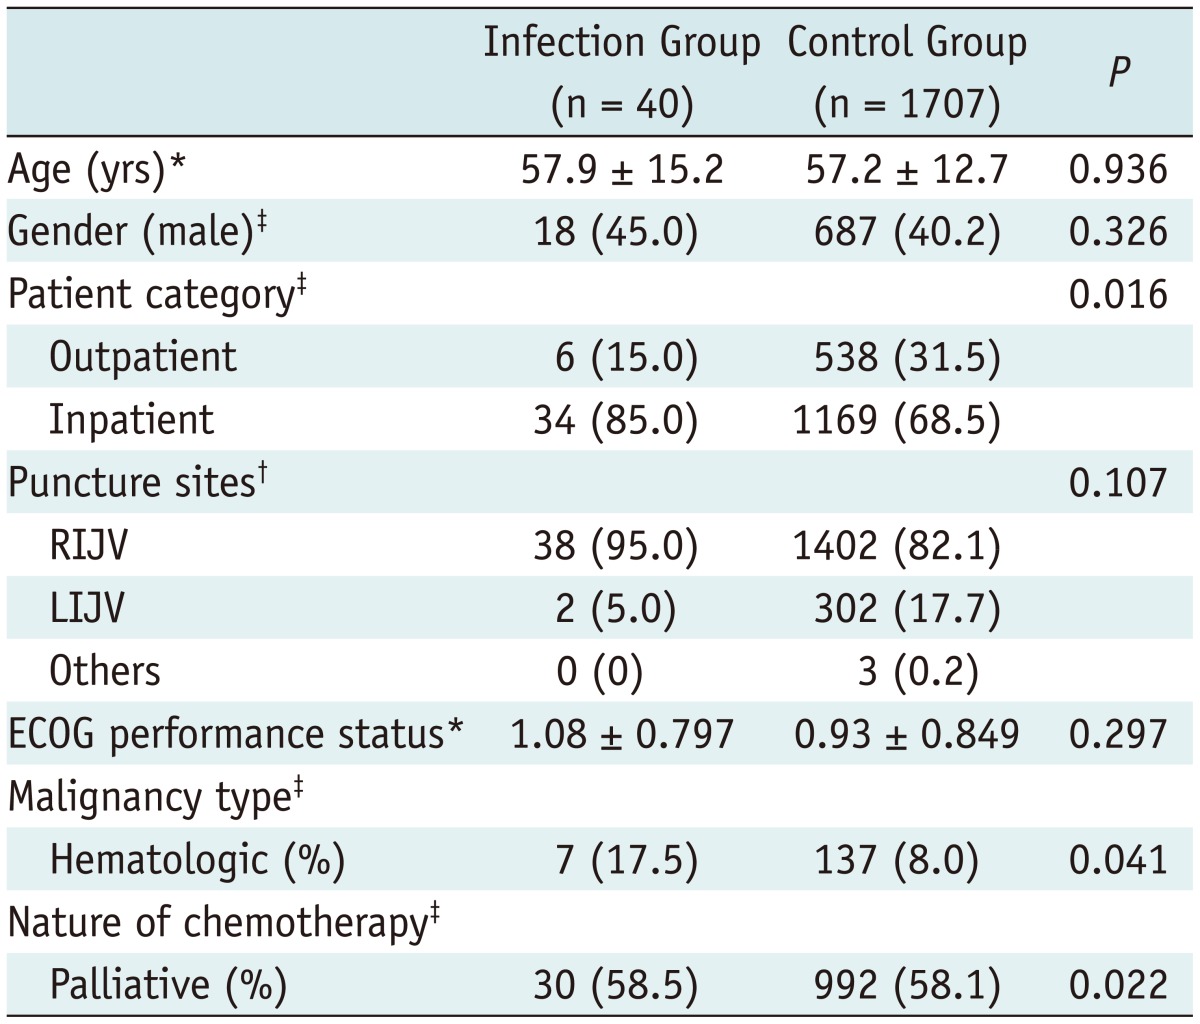
Table 5.
Univariable Comparison between Infection Group and Control Group

Note.-All values in parentheses are in percentile. ECOG performance status is written in average ± standard deviation. Statistical tests were performed with *t test, †Chi-square test, and ‡Fisher's exact test. ECOG = Eastern cooperative oncology group, LIJV = left internal jugular vein, RIJV = right internal jugular vein
