Figure 6.
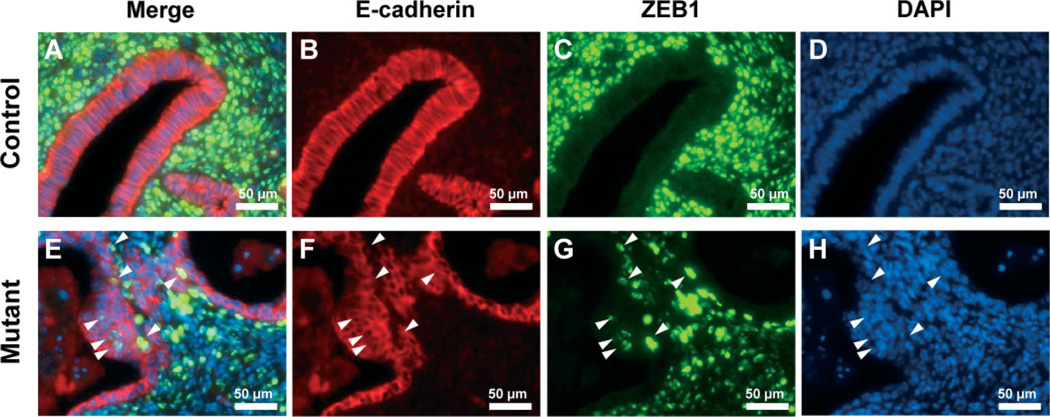
The expression of ZEB1 in uterus of control and mutant mice. Immunofluorescence analysis of E-cadherin (red; B, F) and ZEB1 (green; C, G) was performed in control (A–D) and mutant (E–H) mice. The expression of ZEB1 was observed in epithelial cells of the uterus in mutant but not control mice. Merged images (A, E) and DAPI images (D, F); arrowheads, ZEB1-positive cells

