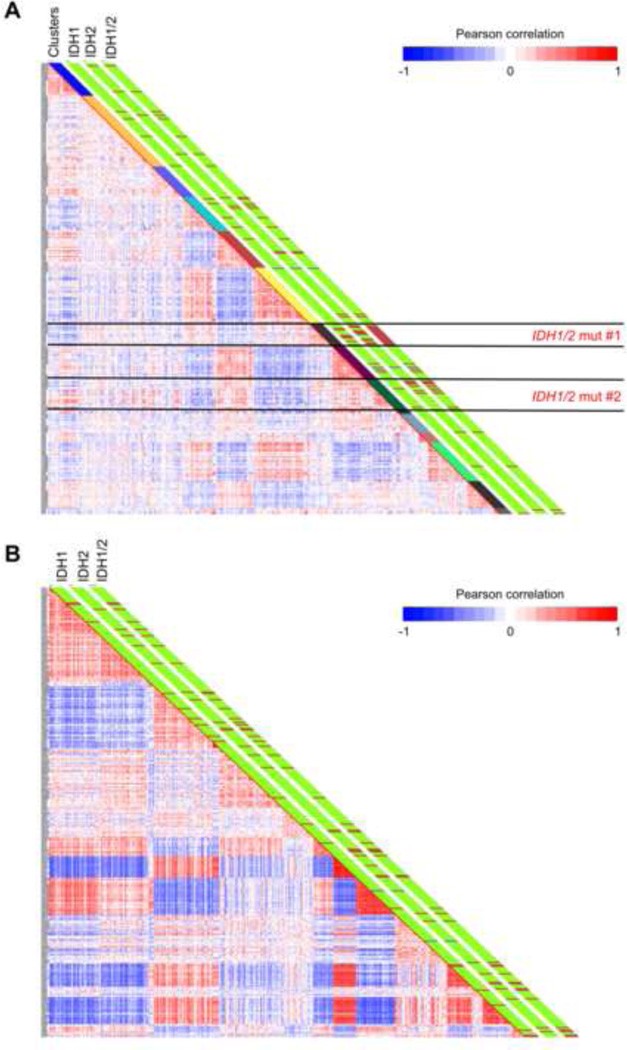
Figure 1. IDH1 and IDH2 mutant AML cases tend to cluster based on their DNA methylation profiles.
(A) Heatmap representation of a correlation matrix in which each patient’s DNA methylation profile is correlated with that of the other patients in the dataset. Patients are ordered according to the unsupervised analysis (hierarchical clustering) results, so that highly correlated patients are located next to each other. Parallel bars on the right of the heatmap have been used to indicate, from left to right: cluster membership, IDH1 mutational status (Green: WT, Dark red: Mutant), IDH2 mutational status (Green: WT, Dark red: Mutant) and combined IDH1/2 mutational status (Green: WT, Dark red: Mutant). (B) Heatmap representation of a correlation matrix in which each patient’s gene expression profile is correlated with that of the other patients in the dataset. Patients are ordered according to the unsupervised analysis (hierarchical clustering) results, so that highly correlated patients are located next to each other. Parallel bars on the right of the heatmap have been used to indicate, from left to right: IDH1 mutational status (Green: WT, Dark red: Mutant), IDH2 mutational status (Green: WT, Dark red: Mutant) and combined IDH1/2 mutational status (Green: WT, Dark red: Mutant). (See also Figure S1 and Table S1).

