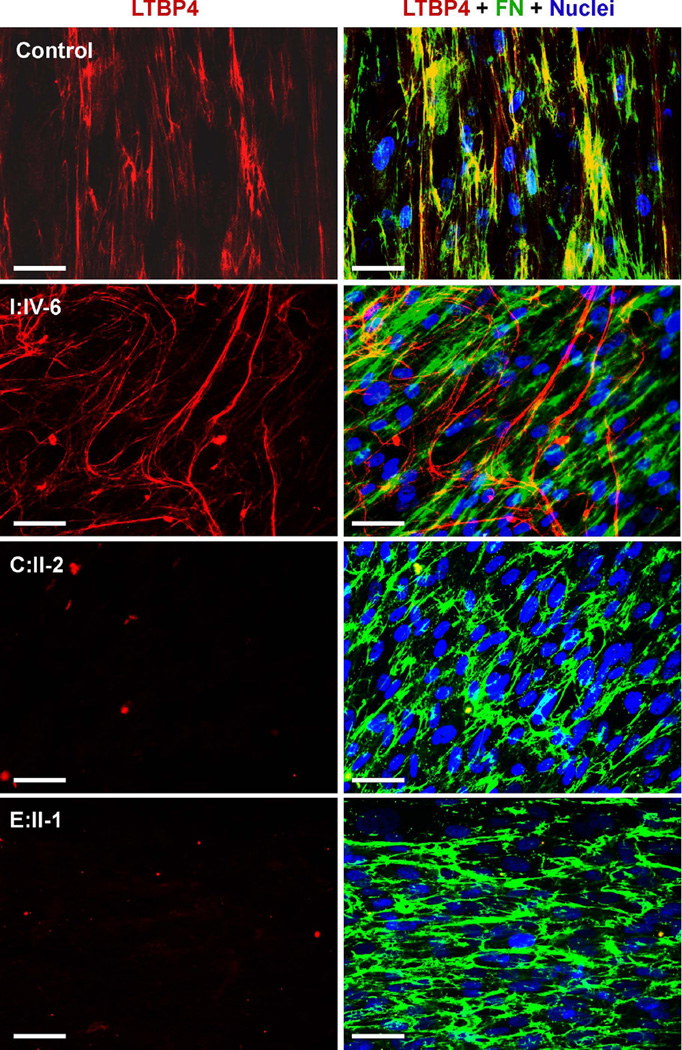
Figure 4. The distribution of fibronectin and LTBP4 in fibroblast extracellular matrix.
Green color, red color and yellow color indicate fibronectin (FN), LTBP4 and colocalization, respectively. Nuclei were counterstained in blue. Control cells show patchy colocalization of LTBP4 with fibronectin. Cells from I:IV-6 deposit largely distinct fibronectin and LTBP4-containing networks. Cells from C:II-2 and E:II-I show no matrix staining for LTBP4. Magnification bars: 50µm.

