
Figure 1.
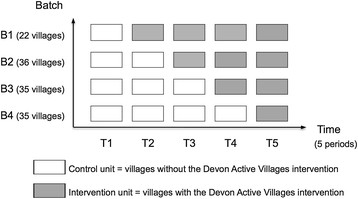
Design of the DAVE study. One batch (B1, B2, B3, B4) represents one group of intervention villages. Each time period (T1, T2, T3, T4, T5) represents a data collection point. Each unit (control or intervention) represents one time period of one batch.