
Figure 1.
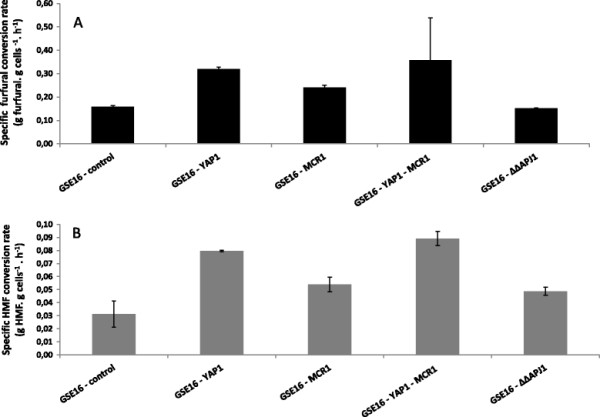
In vivo specific furfural (A) and HMF (B) conversion rates (g.g cells−1 h−1) displayed by the different strains during fermentation of spruce hydrolysate. The values were calculated during the first two hours (furfural) and ten hours (HMF), considering the initial cdw (1 g.L−1). The bars represent mean values of two biological duplicates, and the error bars indicate the standard deviation.