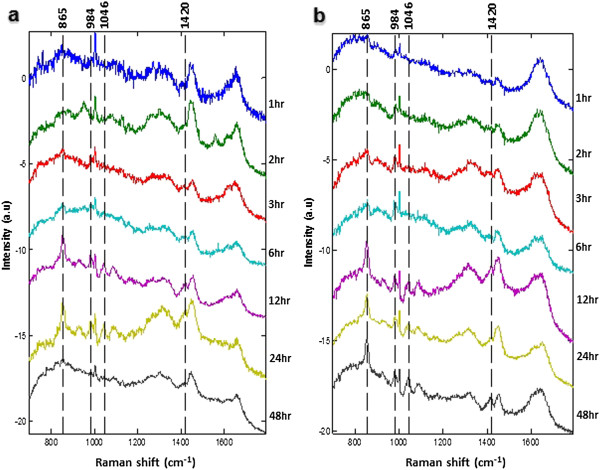
Figure 4.

Comparative time-resolved metabolic footprinting of extracellular metabolites using Raman microspectroscopy. Average Raman spectra of medium of (panel b) noninfected- and (panel b)Neospora caninum-infected HBMECs at different time points post infection. Dotted lines indicate the position of the Raman bands at 865 cm−1, 984 cm−1, 1046 cm−1 and 1420 cm−1.
