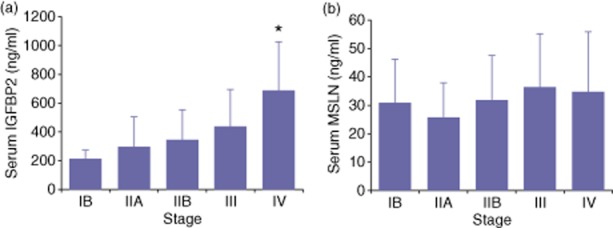
Figure 4.

Stage distribution of serum insulin-like growth factor binding protein 2 (IGFBP2) and mesothelin (MSLN) in pancreatic ductal adenocarcinoma (PDAC) samples. Mean levels of IGFBP2 (a) and MSLN (b) at each stage are represented by the solid bars. Error bars indicate a standard deviation. *P < 0.03 versus all other stages by ANOVA and Tukey–Kramer post-hoc test
