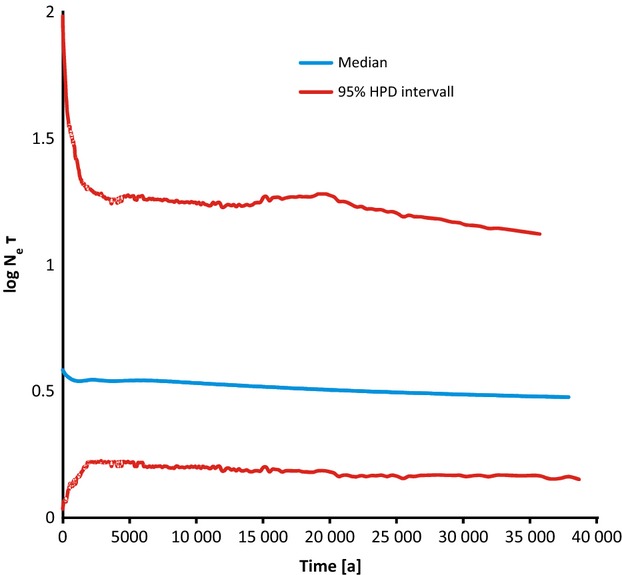
Figure 4.

Extended Bayesian Skyline plot. The plot was derived from the combined cytochrome c oxidase subunit I and ZF alignments of Clade 1. The x axis is in units of years the y axis is equal to log Ne τ (the product of the effective population size and the generation length in years). The thick solid line is the median estimate, and the grey lines show the 95% HPD limits. The plot shows no indications of substantial effective population size dynamics for the last few 10 000 of years.
