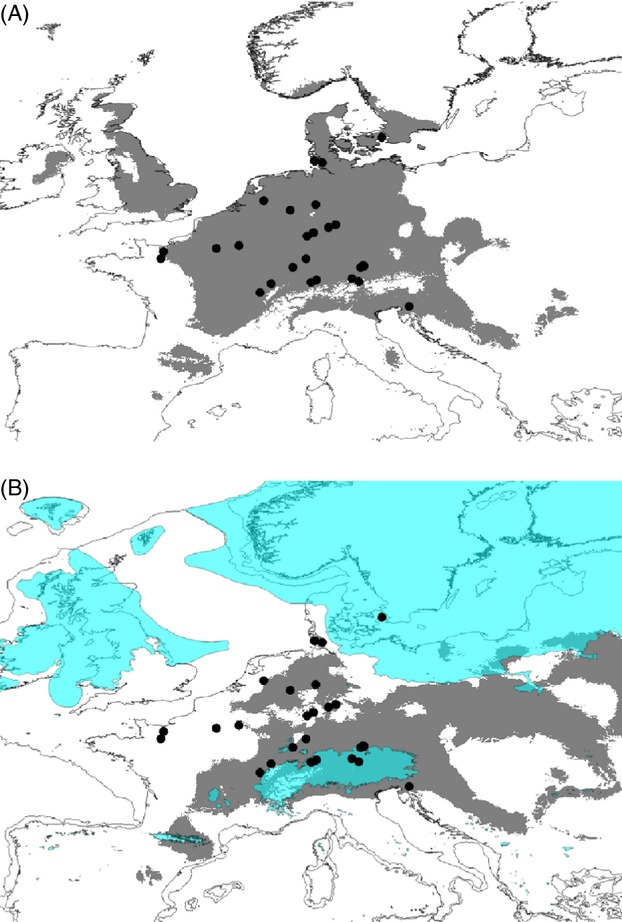
Figure 5.

Species distribution modelling for Clade 1. The potential (A) present and (B) past (Last Glacial Maximum, LGM) distributions are shown in grey. Sites of genetically confirmed occurrence are shown as black circles. The figure (B) contains the LGM coastlines and the extent of the ice shield (petrol).
