
Figure 2.
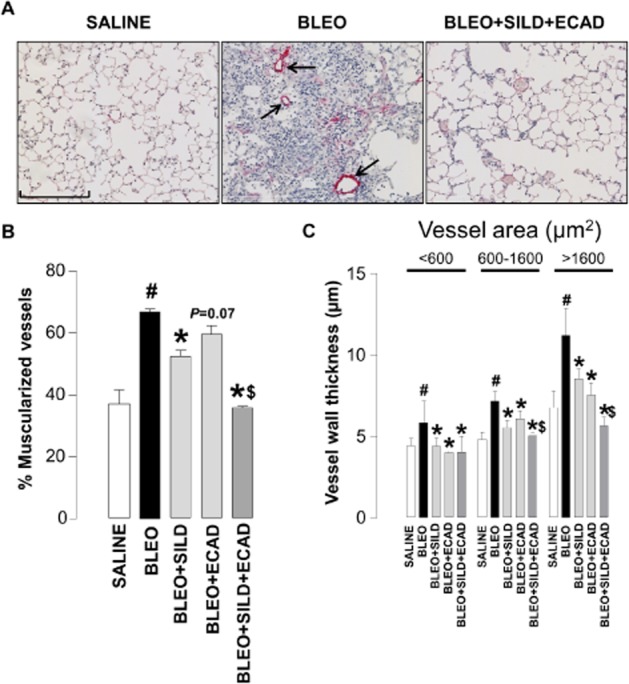
Representative light microscopic images (scale bar = 200 μm) (A), and quantitative assessment of muscularization (B) and wall thickness (C) of pulmonary arteries from saline controls, bleomycin (BLEO; 1 mg·kg−1)-treated animals, and mice receiving bleomycin in the presence of sildenafil (SILD; 30 mg·kg−1·day−1), ecadotril (ECAD; 60 mg·kg−1·da−1) or sildenafil plus ecadotril (doses as above). Arrows indicate areas of overt muscularization (αSMA staining). #P < 0.05 versus saline control; *P < 0.05 versus bleomycin; $P < 0.05 versus bleomycin in the presence of sildenafil or ecadotril monotherapy. n = 17–25 animals in each group.