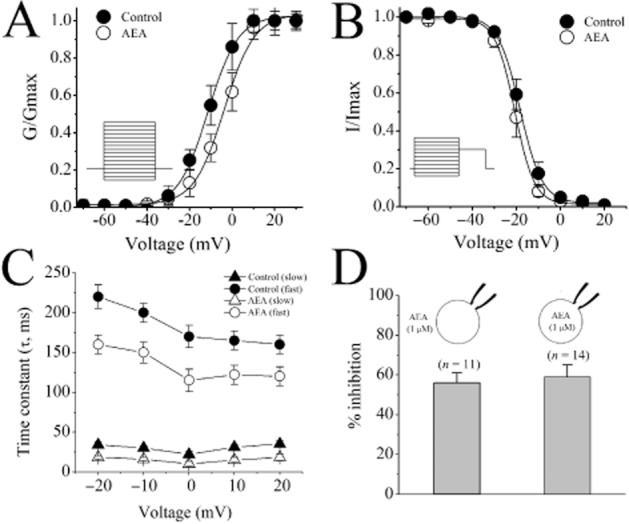
Figure 5.

Effect of AEA on SSA and SSI of ICa and of sidedness of AEA application on ICa in rat ventricular myocytes. (A) SSA and (B) SSI curves of ICa in the absence and presence of 1 μM AEA. Data shown are means ± SEM; n= 5 cells. Fit of experimental data points with Boltzmann equation. (C) Voltage-dependent fast and slow inactivation time constants (τi) of IL,Ca under control conditions and in the presence of 1 μM AEA. Data shown are means ± SEM; n = 5–6 cells. (D) Comparison of the intracellular and extracellular application of AEA on the maximal inhibition of ICa. Data shown are means ± SEM; n = 5–8 cells.
