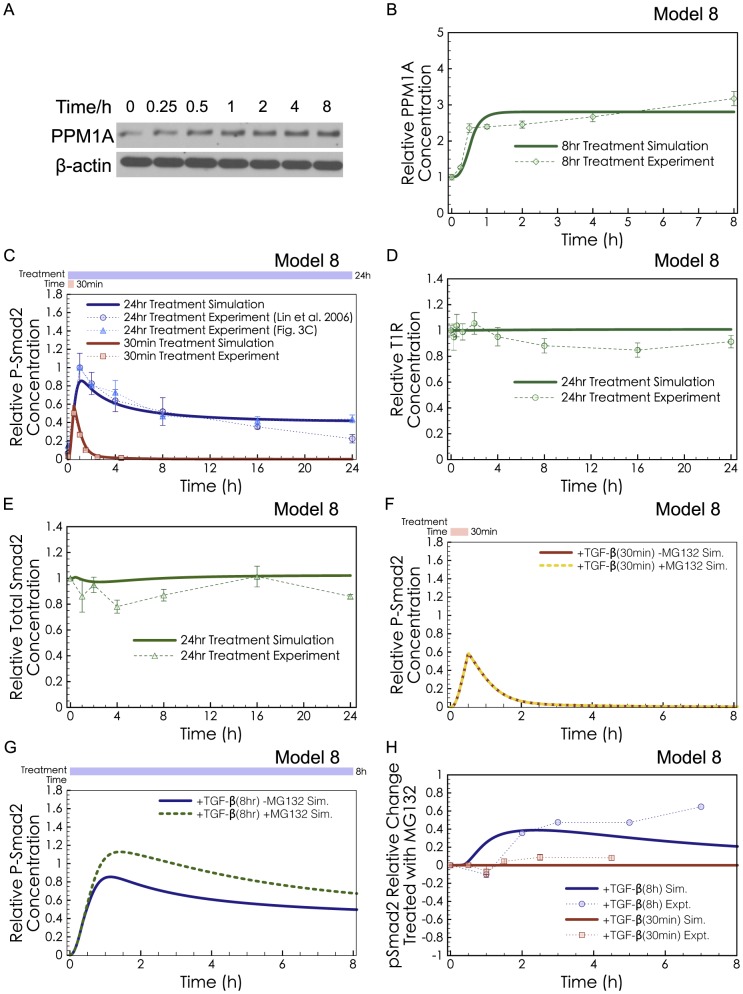
Figure 5. Predictions and validation of PPM1A Upregulation.
(A) Western blot of PPM1A in HaCaT cells with 2 ng/ml TGF-β treatment, representative of 3 replicates. (B) Model 8 predicted PPM1A upregulation under long-exposure of TGF-β (green curve). Our experimental validation showed significant upregulation of PPM1A (green dots, quantification from 3 Western blots, P<0.05 comparing the untreated data point and the 1 hr data point). (C) Model 8 was fitted to the long-exposure and the short-exposure phospho-R-Smad experimental data. (D) Model 8 predicted unchanged T1R levels (green curve), in agreement with our experimental results (green dots). (E) Model 8 predicted unchanged total R-Smad levels (green curve), in agreement with our experimental results (green dots). (F) Red solid curve shows simulation of Model 8 with short-exposure (30 min) of TGF-β, while the yellow dotted curve shows the same simulation except with MG132 pre-treatment. MG132 was simulated as turning off Smurf2-induced P-Smad Degradation (kdegpSmad2 = 0), but having no impact on basal degradation of Receptors, unphosphorylated R-SMAD, or PPM1A. (G) The blue solid curve shows simulation of Model 8 with long-exposure (8 hr) of TGF-β, and the green dotted curve shows the same simulated except with MG132 pre-treatment. (H) The relative change in P-Smad2 levels after MG132 treatment, calculated from Eq. 1 and simulations of Model 8. The P-Smad2 change simulated using Model 8 in both short-exposure (30 min, red curve) and long-exposure (8 hr, blue curve) simulations was compared with the P-Smad2 changes in the experimental results of Lin et al. [9] (30 min-exposure, red dots) and Alarcon et al. [21] (6 hr-exposure, blue dots). Data points from Alarcon et al. [21] were quantified from one published image. The discrepancy between our simulations and Alarcon et al. for the 7 hr measurement may be partially explained by MG132-independent differences. Their -MG132 control decreases much faster than that from Lin et al. [9] and from our experiments.

