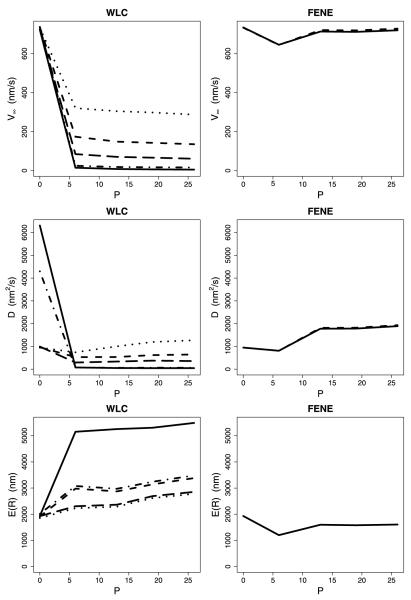
Fig. 9.
Comparison of WLC and FENE for the scenario of strain-dependent detachment. Each WLC plot shows curves for various combinations of db and Lp—(2, 2) (solid); (2, 4) (short dash); (2, 6) (dot); (4, 4) (dash-dot); and (4, 6) (long dash). Each FENE plot shows curves for db equal to 2 (solid) and 4 (long dash) (with κ = 0.1)

