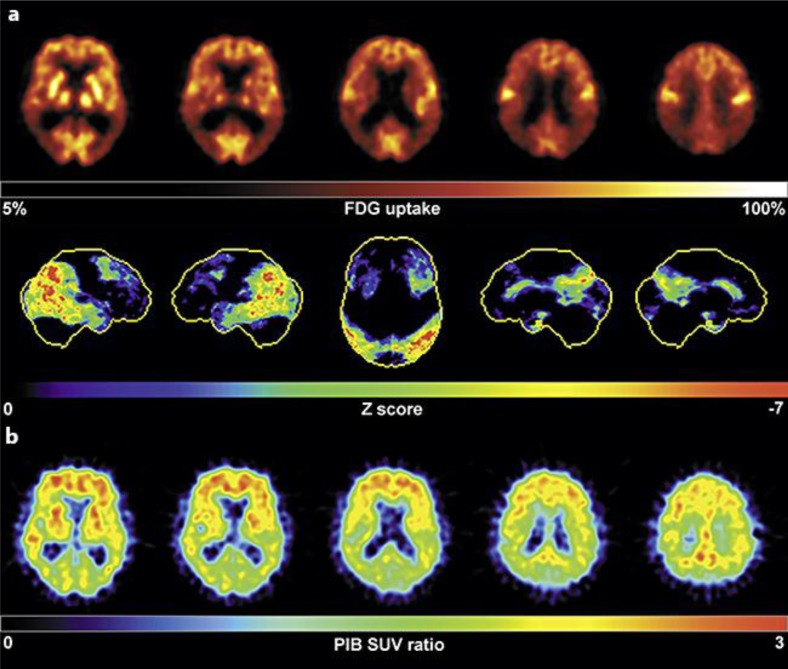
Fig. 2.
Results of 18FDG (a) and [11C]PIB (b) PET examinations. a The upper- and lower-row images show transaxial 18FDG PET images and three-dimensional surface projections (left and right lateral views, top view, right and left mesial views) of regions with decreased 18FDG uptake (color-coded as Z score), respectively. Note the marked bilateral hypometabolism of the temporoparietal region and of the posterior cingulate gyrus/precuneus. A less marked hypometabolism was also found in the bilateral frontal and mesiotemporal lobe. b Depiction of the corresponding transaxial [11C]PIB PET images that show the typical regional pattern of fibrillar amyloid-β binding in AD (strongest in the frontal cortex and posterior cingulate gyrus/precuneus, less so in the temporoparietal cortex).

