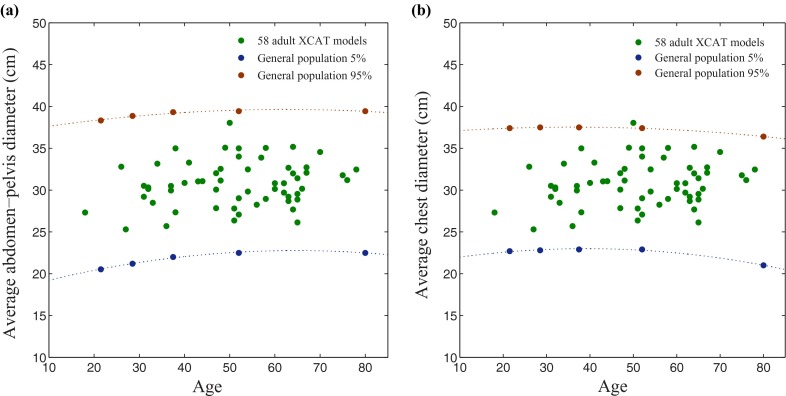
FIG. 1.
Variability in size among the patient models. The individual data points represent the average diameter of (a) abdomen-pelvis and (b) chest for 58 individual models, while lines represent the various (5% and 95%) percentiles according to general population-based studies (PeopleSize 2008, Open Ergonomics, UK).

