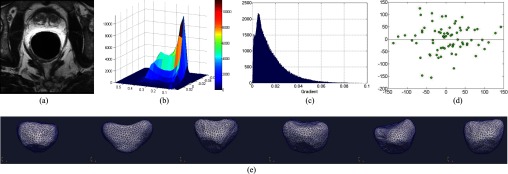
FIG. 1.

Complicated non-Gaussian distribution of appearance features in MR prostate images. (a) A typical slice of a T2-weighted MR prostate image. (b) Joint distribution of intensity and gradient of voxels within prostate regions across ten subjects. (c) The histogram of gradients within prostate regions across ten subjects. (d) Prostate shape distribution along the two major shape variation modes, corresponding to the two eigenvectors with the largest eigenvalues by PCA. (e) Shape models obtained for different patients, which demonstrates the large interpatient shape variations.
