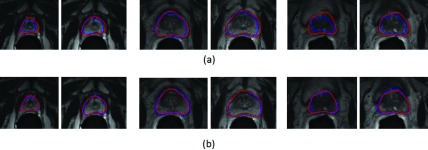
FIG. 13.

Typical segmentation results for prostate apex (left), central (middle), and base (right) regions of two patients produced by (a) ASM and (b) our proposed deformable model. The first row demonstrates the segmentation results for ASM, and the second row demonstrates the segmentation results for our proposed deformable model. The three main columns show the segmentation results for the apex, central, and base regions of the two patients, respectively. Light grey contours indicate the manual segmentations, and dark grey contours indicate the automatic segmentations.
