
FIG. 14.
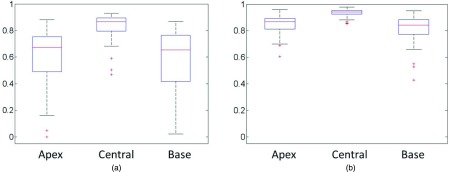
The box and whisker diagrams of DSC, measured at the apex, central, and base regions of the prostate, by (a) ASM and (b) our proposed deformable model for all 75 images.
Official websites use .gov
A
.gov website belongs to an official
government organization in the United States.
Secure .gov websites use HTTPS
A lock (
) or https:// means you've safely
connected to the .gov website. Share sensitive
information only on official, secure websites.
The box and whisker diagrams of DSC, measured at the apex, central, and base regions of the prostate, by (a) ASM and (b) our proposed deformable model for all 75 images.