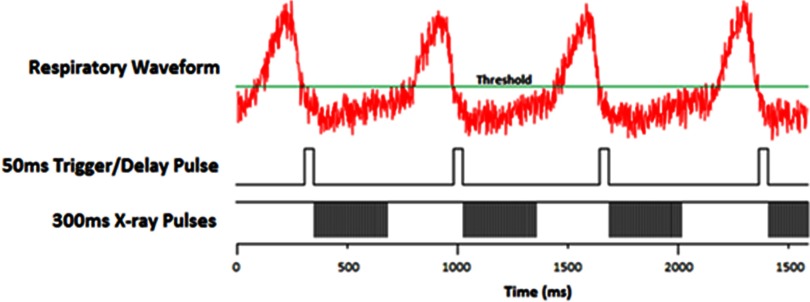
FIG. 4.
X-ray exposure pulse diagram. The top is the BioVetc output of the respiratory motion from the pressure sensor attached to the mouse. The threshold is set by the operator as low as possible but still having the “motionless” state below it. The second pulse sequence shows the delay pulses that start the irradiation on a high-to-low trigger. The last sequence shows the cathode pulses that generate the x-rays. The cathodes are negatively pulsed at 500 μs pulse widths with an 8% duty cycle.

