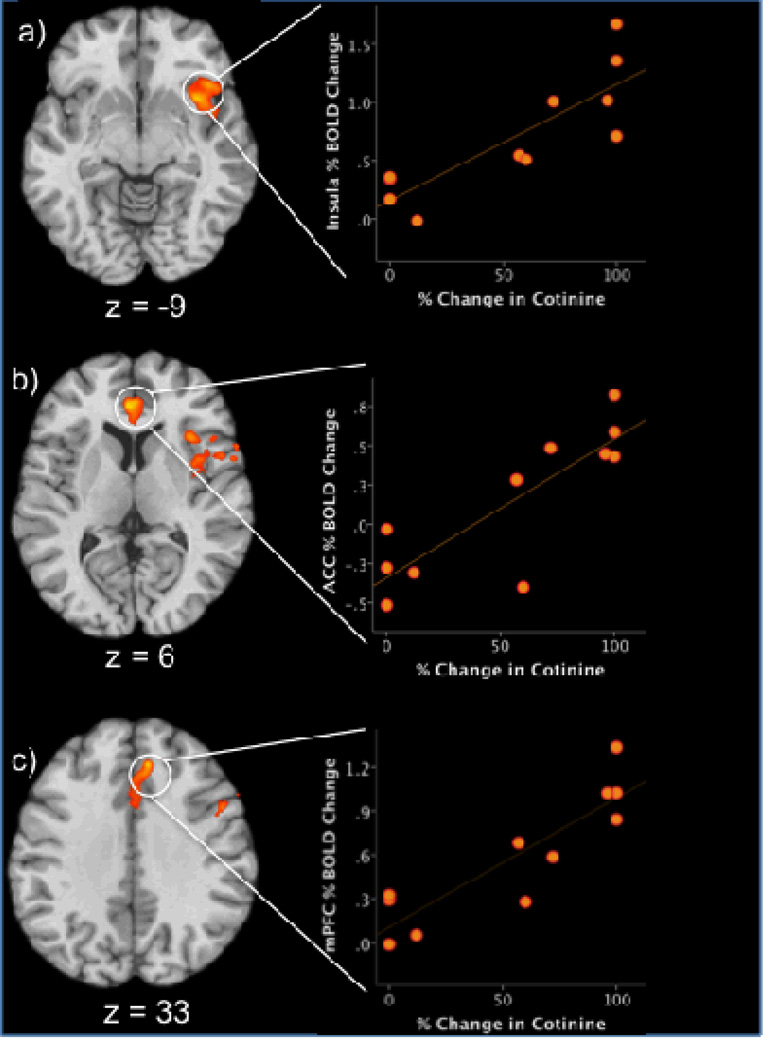
Figure 1.
Significant correlations between Stroop related activation and percent changes in cotinine levels (left side of figure). Orange/yellow indicates areas of positive correlations between % decrease in cotinine levels and increased % BOLD signal changes in the incongruent versus congruent contrast. Axial slices demonstrate the correlation with a cluster in the right insula (z=−9), ACC (z=6) and dorsal mPFC (z=33). Numbers indicate z-axis MNI coordinates. Right side of the brain is on the right. Scatterplots (right side of figure) demonstrate the distribution of individual scores in the correlation between % change in cotinine levels and % BOLD signal change in A) Insula, B) ACC, and C) medal prefrontal cortex, during Stroop task performance in the adolescent smoking group (n = 11).
BOLD = blood-oxygenation-level-dependent
MNI = Montreal Neurological Institute
ACC=anterior cingulate cortex
mPFC= medial prefrontal cortex
r = Pearson correlation coefficient

