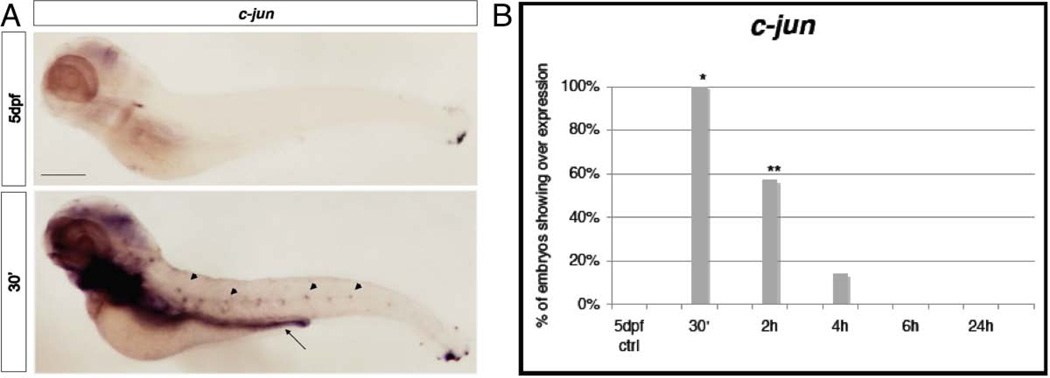
Figure 5. WISH analysis of c-jun.
A, Expression at 30’ after the ET treatment, at the level of the gut (arrow) with homogeneous coloration and in the neuromasts of the lateral line (arrowheads) compared with the normal expression in the 5dpf untreated larvae. Size bar 100µm. B, Chart indicates the percentage of larvae showing expression of c-jun in the gut and neuromasts of 5dpf larvae at 30’, 2h, 4h, 6h and 24h from the ET treatment. * p≤0.001; ** Is p≤0.002 (Fisher’s exact test).

