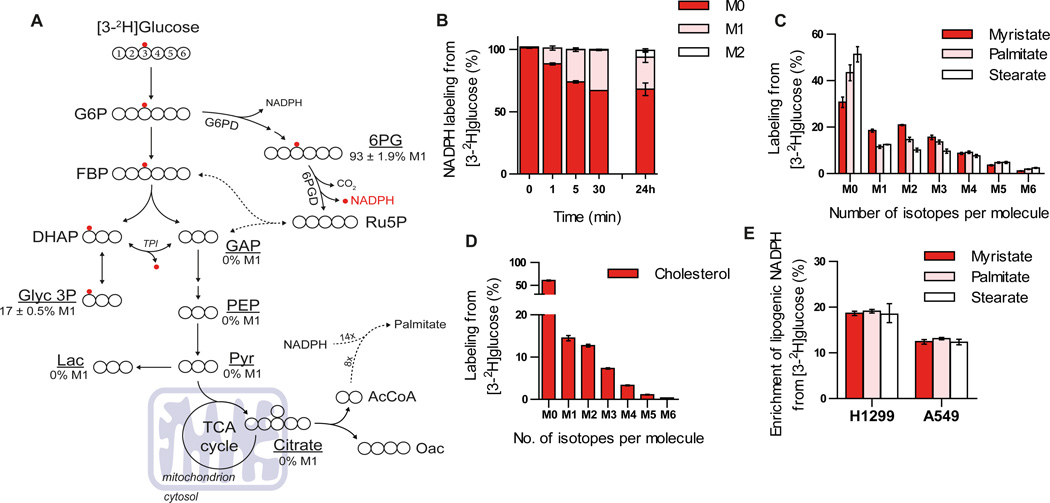
Figure 1. Use of 2H glucose to label cytosolic NADPH.
A) Atom-transition map depicting a model of deuterium transfer from [3-2H]glucose through glycolysis and the pentose phosphate pathway. Open large circles represent carbon and small red circles indicate deuterium label from [3-2H]glucose. Where measured, enrichment of M1 isotopomer (%) for glycolytic intermediates in parental H1299 cells is shown. B) Labeling of NADPH from [3-2H]glucose in parental H1299 cells over time. C) Saturated fatty acid labeling (myristate; C14:0, palmitate; C16:0 and stearate C18:0) from [3-2H]glucose in parental H1299 cells following incubation for 72 hours. D) Cholesterol labeling from [3-2H]glucose in parental H1299 cells cultured for 72 hours. E) Enrichment of lipogenic [2H]-NADPH by [3-2H]glucose estimated by a model for saturated fatty acid synthesis (ISA) in parental H1299 and A549 cells following incubation with tracer for 72 hours. Data plotted in a-d represent mean ± SD of at least three biological replicates. For e, data presented are mean ± 95% confidence interval of at least three biological replicates.

