
Figure 4.
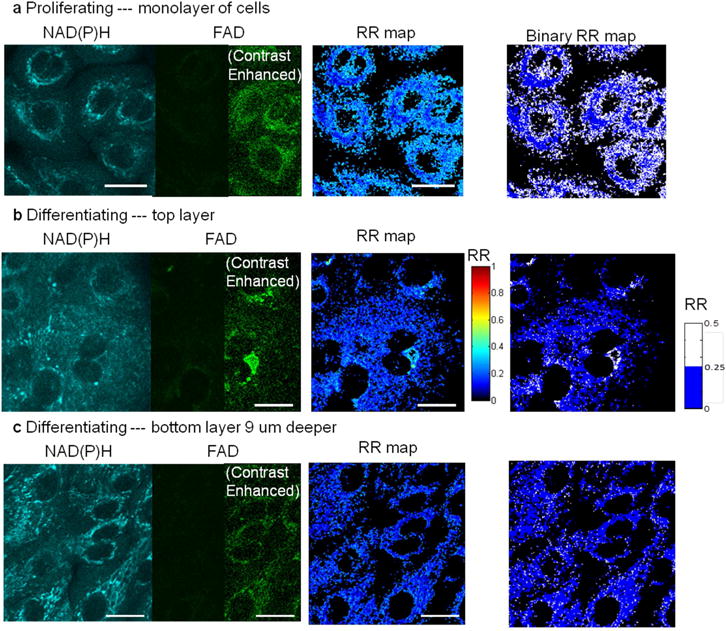
Label-free optical microscopy imaged (section thickness < 1 μm) a single layer of primary human oral keratinocytes in culture. In low-calcium (0.06 mM) medium, keratinocytes proliferated, forming a cellular monolayer. (b) In high-calcium medium (1.2 mM), keratinocytes differentiated into a layered structure, which was sectioned by nonlinear optical microscopy. Proliferating cells were spatially separated as compared to differentiating cells, which tended to crowd together. Shown in (b) and (c) are images of two layers at the same site, and the bottom layer is 9 μm deeper than the top. Both proliferating and differentiating keratinocytes exhibit high NAD(P)H fluorescence but low FAD fluorescence, resulting in a low RR (noted as blue pixels in the RR maps). In particular, proliferating keratinocytes in (a) have low perinuclear RR because highly metabolic mitochondria gathered around the nuclei, shown as the dark blue rings in the binary RR map. Differentiating keratinocytes in (c), on the other hand, homogeneously exhibit dark blue pixels over the binary RR map. In addition, as keratinocytes differentiated upwards, some cells had slightly higher average RR seen as the appearance of light blue pixels in the differentiating layer RR map, indicating their decreasing metabolic activity. Scale bar: 20 μm. Note: For display, contrast enhancement on half of the dim panels was performed by setting image minimum at 10 and maximum at 100 in a scale of 0–255.