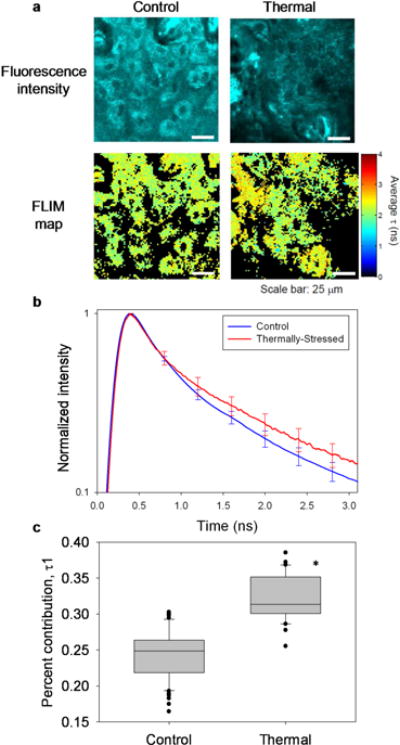
Figure 6.

Label-free fluorescence lifetime analysis successfully distinguished control from thermally-stressed EVPOMEs. (a) Representative en-face, optically sectioned NAD(P)H fluorescence intensity images and corresponding FLIM maps for an analyzed region-of-interest in control (left) and thermally-stressed (right) EVPOMEs. Larger mean fluorescence lifetime t was observed in FLIM maps of thermally-stressed constructs relative to controls. (b) Mean of normalized fluorescence decays from regions-of-interest support the observation from FLIM maps that thermally-stressed constructs exhibited greater mean NAD(P)H fluorescence lifetimes than controls. Error bars represent s.e.m. (c) NAD(P)H fluorescence decays measured from constructs were best fit to a two-exponential decay model. Model fits revealed that the percent contribution of τ1 (attributed to bound NAD(P)H) to the measured fluorescence decay was significantly higher in thermally-stressed EVPOMEs than in controls (n = 5 batches with 58 control and 33 thermally-stressed regions analyzed, P-value < 0.001).
