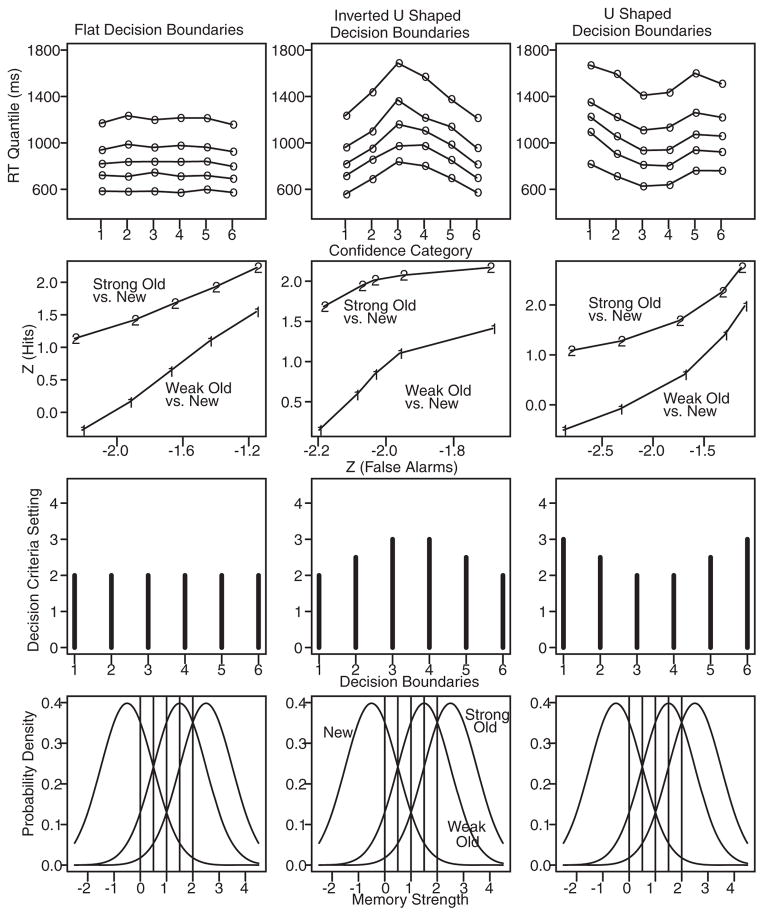
Figure 2.
Data were simulated for three conditions of a recognition memory experiment: new items (mean strength = −0.5), weak old items (mean strength = 1.5), and strong old items (mean strength = 2.5). The bottom row of the figure shows their distributions of strength (for these simulations, across-trial variability in memory strength was small at .05 for all items) and five confidence criteria. The second-from-bottom row shows the decision criteria that were used to simulate data: equal criteria for each confidence category, inverted U-shaped, and U-shaped. The top row shows the .1, .3, .5, .7, and .9 quantile response times (RTs) for one condition, strong old items. The second-from-top row shows z-ROC functions derived from the weak old and new item conditions and from the strong old and new item conditions. Nondecision time was 323 ms, within-trial variability was .09, the scaling parameter a was .035, across-trial variability in boundaries was 1.13, and the range in nondecision time was 108 ms.

