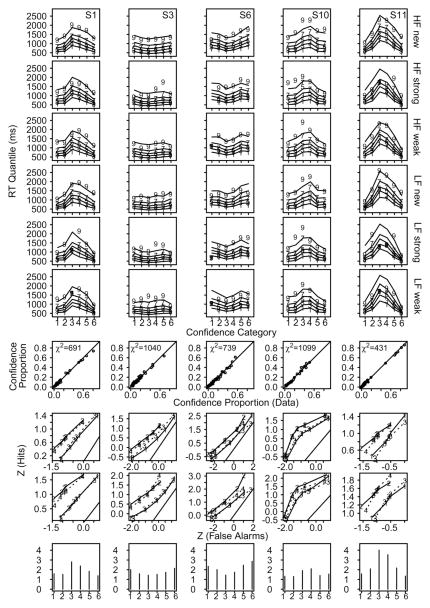
Figure 3.
Plots of model fits and data for 5 subjects showing the largest differences in z-ROC shape from Experiment 5 in Ratcliff et al. (1994). The top six rows show response time (RT) quantiles as a function of confidence for high-frequency (HF) new words, HF strong old words, HF weak old words, low-frequency (LF) new words, LF strong old words, and LF weak old words. The 1, 3, 5, 7, 9 symbols are the .1, .3, .5, .7, and .9 quantile RTs from the data, and the lines are the model predictions. The seventh row shows a plot of empirical against predicted response proportions (for the six confidence conditions and six experimental conditions). The eighth row shows empirical and predicted z-ROC functions for weak and strong LF words (data are “1” for weak and “2” for strong, and model predictions are “3” and “4”). The ninth row shows empirical and predicted z-ROC functions for weak and strong HF words. The tenth row shows the decision boundaries for the best fit to the data.

