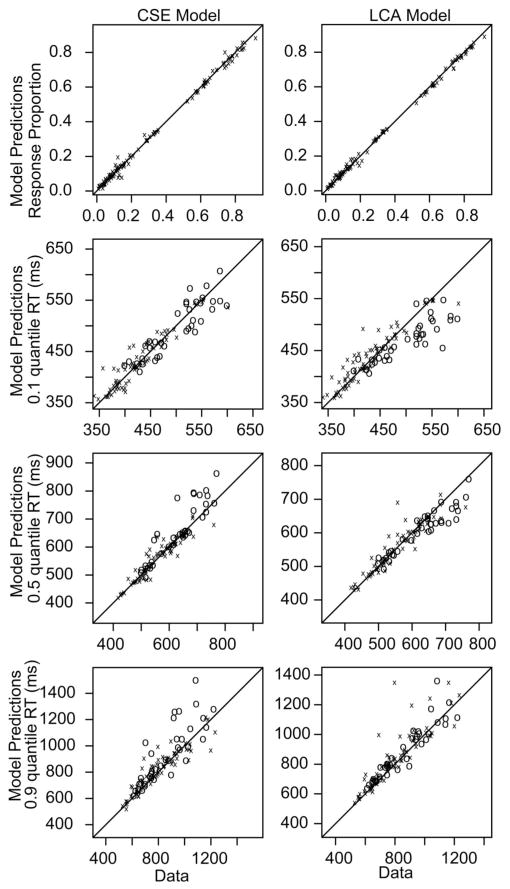
Figure 6.
Fits of the multiple-choice model for response proportion, and the .1, .5, and .9 quantile response times (RTs) for the constant summed evidence model (first column) and the leaky competing accumulator algorithm (LCA) model (second column). The circles are for the conditions with the lower proportion of responses, and the xs are for the higher proportion conditions. CSE = constant summed evidence.

