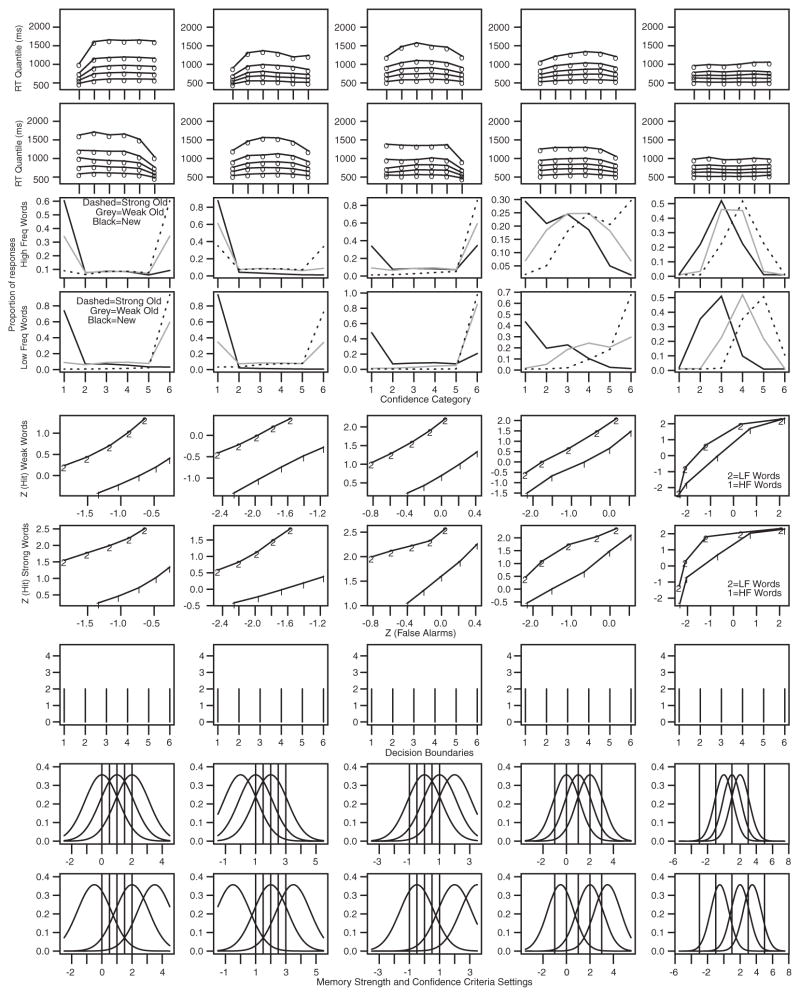
Figure A1.
Simulated data from the model with confidence criteria changing across columns. The top two rows are representative response time (RT) quantiles for new low-frequency words (top row) and strong old low-frequency words (second row). The third and fourth rows show response proportions for weak and strong old items and new items for high- and low-frequency words. The fifth and sixth rows show z-ROC functions for strong and weak high- and low-frequency words. The seventh row shows decision boundaries. The eighth row shows distributions of memory strength for new high-frequency words, weak old high-frequency words, and strong old high-frequency words. From the left to the right columns, the confidence criteria are narrow (set at 0, 0.5, 1, 1.5, and 2), move right by 1 unit, move left by one unit from those in column 1, and then spread out (−1, 0, 1, 2, and 3), and then spread out again (−3, −1, 1, 3, and 5). Freq = frequency; LF = low frequency; HF = high frequency.

