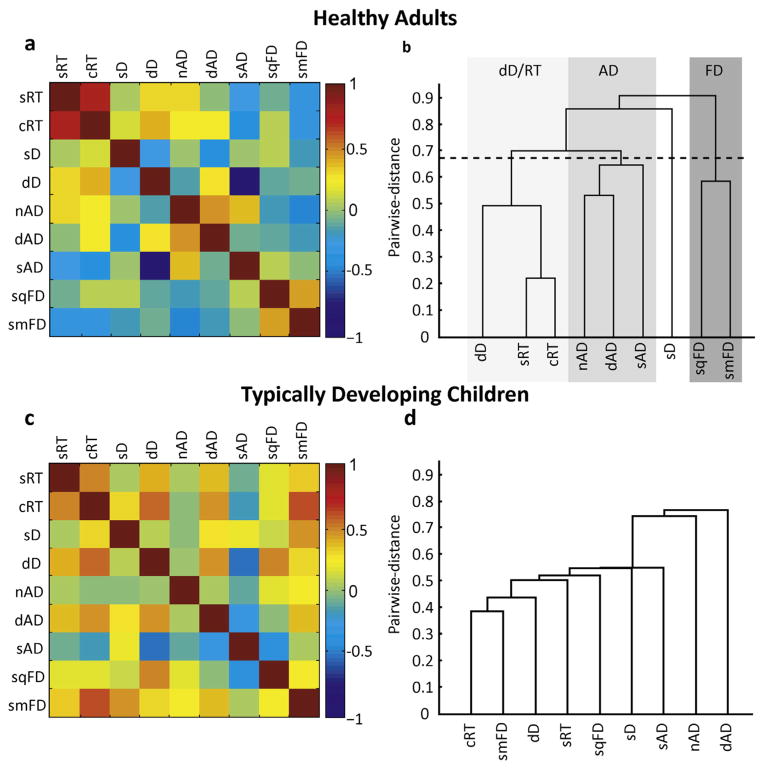
Fig. 3.
Correlation matrix and cluster analysis. (a) In HA, three different task groupings (RT + DT; AD; FD) correlated with each other. Furthermore, the sAD was negatively correlated with the corrected dD threshold (R = −0.83). (b) Cluster analysis clustered different tasks-groups within separate branches, although dD clustered with RT to some extent. (c) In the TDC, the correlation matrix showed more, but weaker correlations. The RT tasks are correlated with each other (R = 0.49) and with both detection threshold tasks (R = 0.38). Consistent with the HA group, the dD threshold was negatively correlated with the sAD (R = −0.51). However, the correlations among the amplitude discrimination tasks and among the frequency discrimination tasks, as shown in the HA group, were absent in the TDC group. (d) No clustering could be observed in the TDC.

