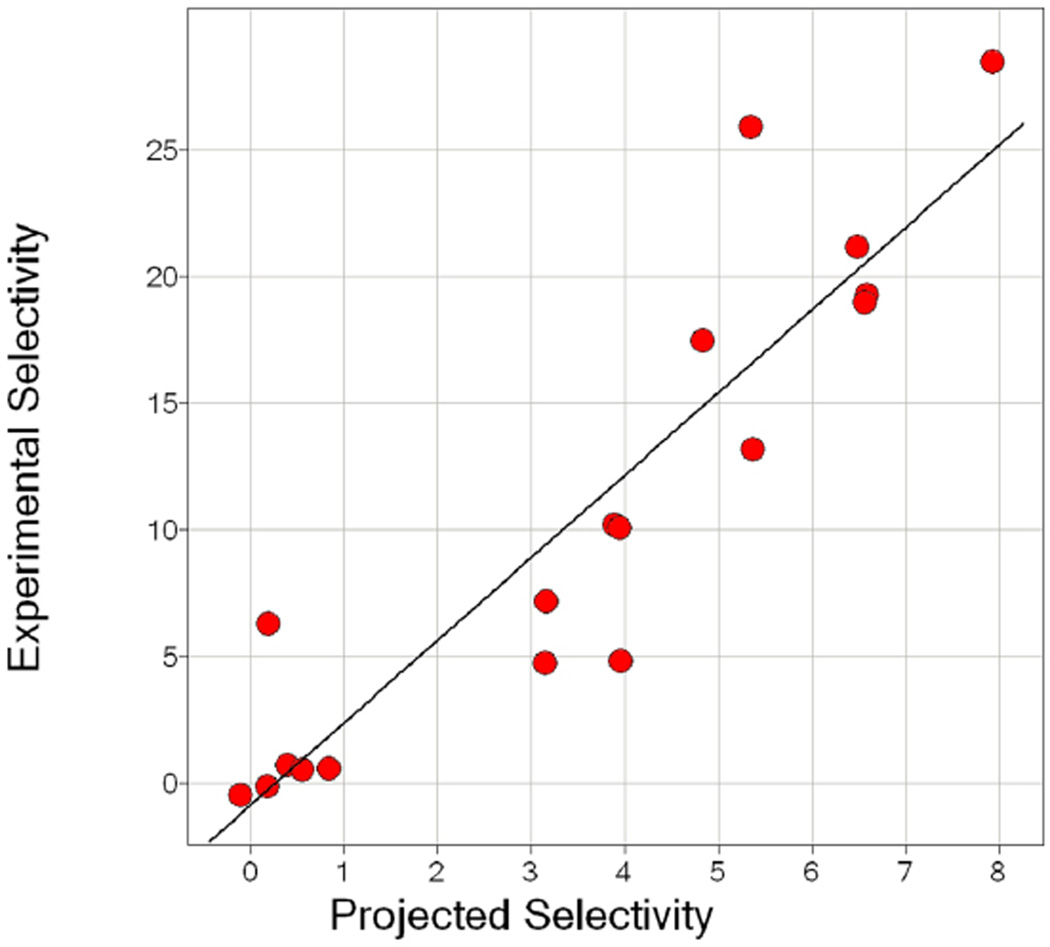
Figure 3.
The values for “Projected Selectivity” and “Experimental Selectivity” shown in Table 2 for the 18 compounds are graphed in the scatter plot. Each dot corresponds to one of the 18 compounds. The Experimental Selectivity value is calculated using the following equation (Ki α3β4 – Ki α4β2)/(Ki α4β2). The Projected Selectivity value is a value “projected” from using the 1169 library data. The methodology used to determine the Projected Selectivity is detailed in Materials and Methods. In brief, first a projected activity value for each compound is determined for both receptors. This is done by taking the product of the activity value of the 1169 positional scanning sample that corresponds with the functionality used in the Table 2 individual compounds. Once this value is obtained for each of the compounds and for both receptors, the Projected Selectivity value can be determined using the same selectivity formula used for the Experimental Selectivity values.

