
Table 2.
The Functionalities, Ki Values, and Selectivity (Both Experimentally Determined and Projected) for the 18 Individual Compounds Synthesized Based on the Data Generated from the Screening of 1169 are Showna
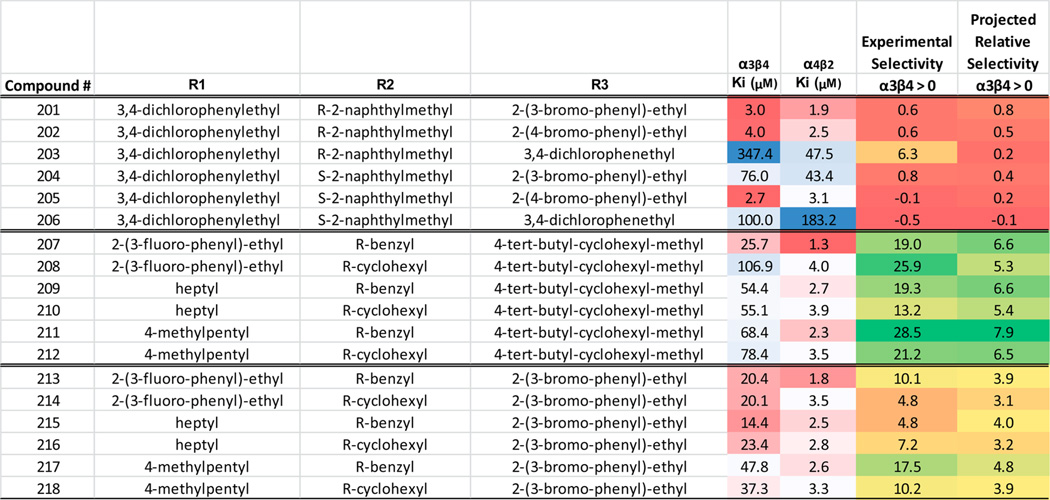 |
The functionalities correspond to the core scaffold shown in Table 1. The activity data is presented as a Ki (µM) for each individual compound against each of the two targets. The experimental selectivity is the value obtained from (Ki α3β4 - Ki α4β2)/(Ki α4β2). The projected relative selectivity value is generated from using only library 1169 data as described in the Materials and Methods section. The Ki values are further color coded using a three-color scale: red (most active), white, blue (least active). The fold selectivity values are also color coded using a three-color scale: green (more selective for α4β2), yellow, red (less selective for α4β2). A value of 0 for fold selectivity means a sample produced the same activity in both receptors. Note the strong correlation between the experimental and projected selectivity values (R2 = 0.831), also shown in Figure 3.