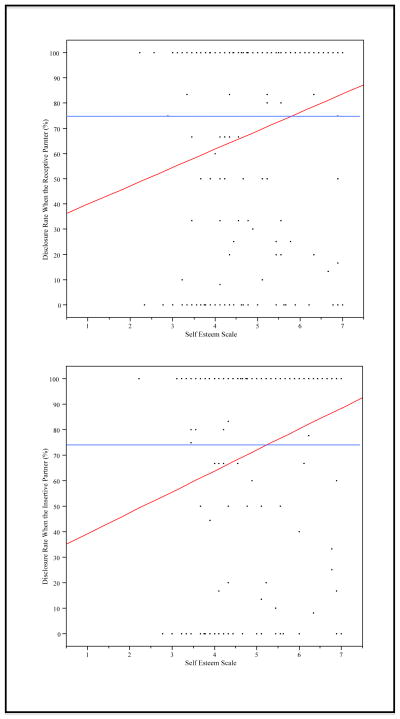
Figure 1.
HIV-positive men’s self-esteem predicting HIV disclosure when the receptive partner and when the insertive partner. The topmost graph represents disclosure when the receptive partner (p < .01, β = .22). The bottommost graph represents disclosure when the insertive partner (p < .001, β = .30). Both graphs represent the relationships among HIV-positive men after controlling for the variables: age, survey location, number of receptive partners and receptive anal condom use (for disclosure when the receptive partner), and number of insertive partners and insertive anal condom use (for disclosure when the insertive partner). Horizontal lines in the graphs represent the mean disclosure rates for the sample.

