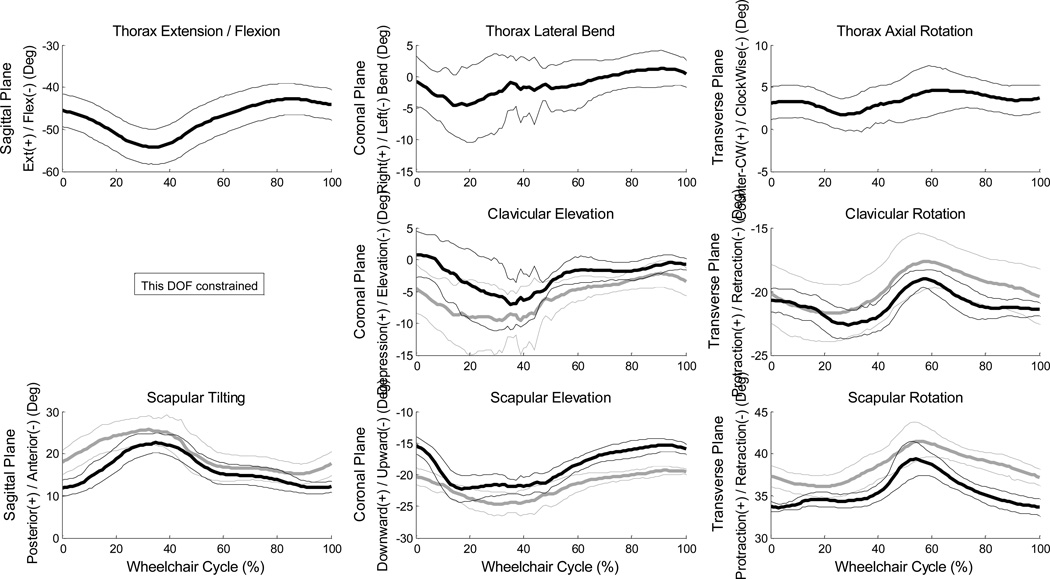
Figure 2.
Ensemble average joint kinematic data for 10 stroke cycles of the thorax, sternoclavicular and acromioclavicular joints. Mean (bold) and +/− one standard deviation joint kinematics of the thorax: top row, the sternoclavicular (SC) joint: middle row, and the acromioclavicular (AC) joint: bottom row. (left side: grey, right side: black)

