Figure 5.

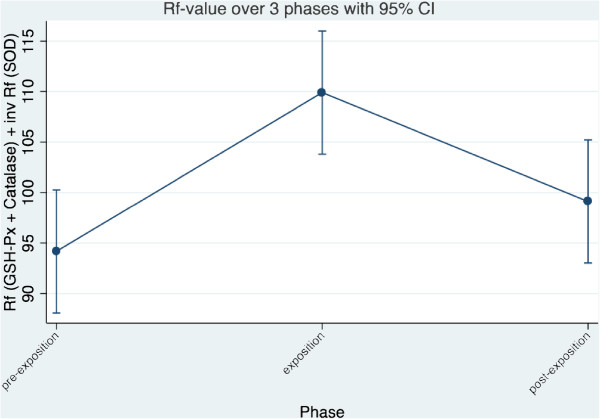
Trend of the summarized Rf-value for GSH-PX, Catalase and the inverse SOD value of all cows together across the three phases. For calculation of the Rf-value refer to materials and methods.

Trend of the summarized Rf-value for GSH-PX, Catalase and the inverse SOD value of all cows together across the three phases. For calculation of the Rf-value refer to materials and methods.