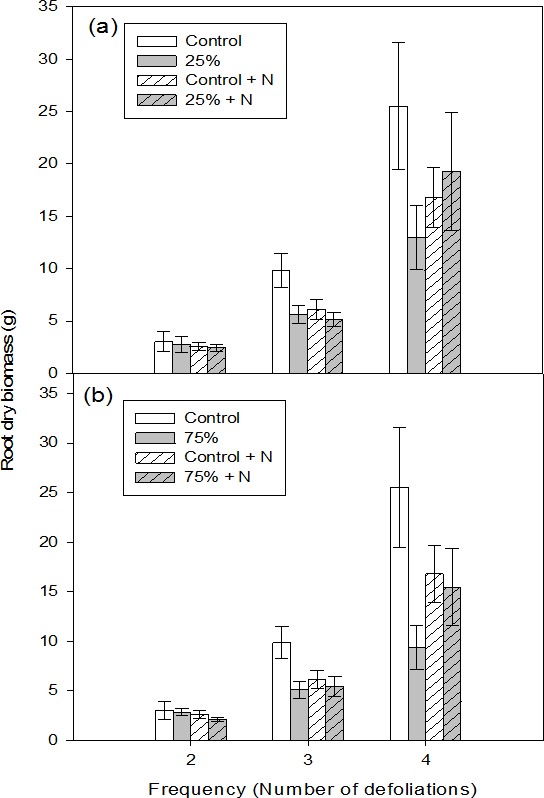
Figure 2. Root dry biomass of aspen seedlings after low (A, 25%) and high (B, 75%) intensities of defoliations, applied two, three, and four times.

Hatched bars indicate fertilized treatments. Each bar and error bar gives the mean and SE, respectively, for seven seedlings.
