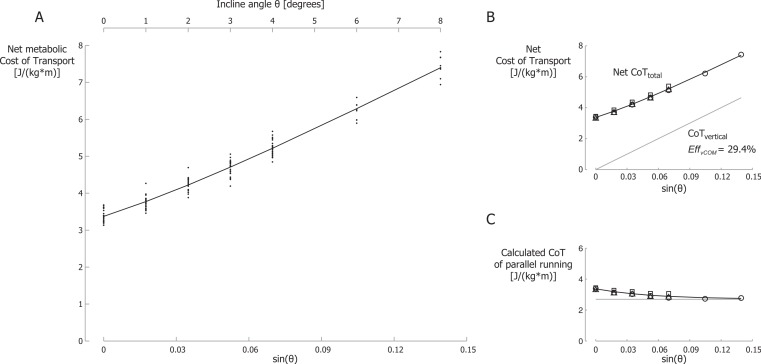
Figure 4. Net metabolic Cost of Transport.
(A) Net metabolic Cost of Transport (CoT) for different inclines and velocities. CoT is the net metabolic energy consumed per meter traveled parallel to the running surface. Each small dot represents a single participant’s CoT for a specific trial. The black line is the best-fit curve of the net CoT according equation 8. Note that the secondary horizontal axis at the top is the incline angle θ, which is not linear, so the tick marks are not evenly spaced. (B) Net metabolic CoTtotal and metabolic CoTvertical. (C) Metabolic CoT of parallel running. The grey line represents the constant CoT components of parallel running (perpendicular bouncing, leg and arm swing and lateral balance); the remainder, the CoT of braking and propelling, approaches zero at steeper inclines. Symbols represent mean values: ∘, 2.0 m/s; Δ, 2.5 m/s; □, 3.0 m/s.

