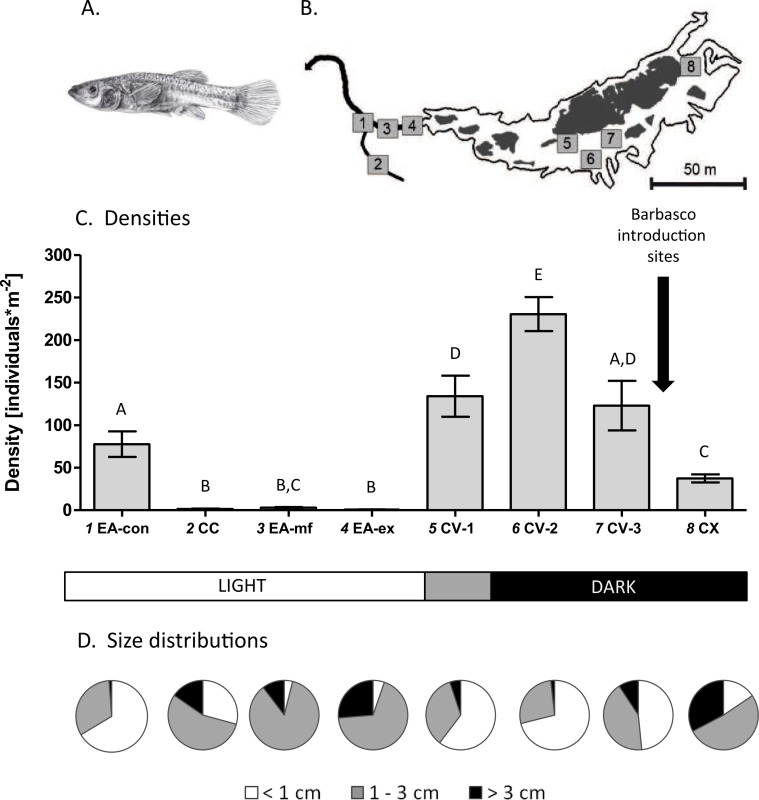
Figure 1. Study system and population densities.
(A) Drawing of a female cave molly. (B) Map of the study area showing the different sampling sites (numbers) where white areas represent water within the cave (Cueva del Azufre) and dark areas indicate dry land and bedrock. 1 EA-con, 2 CC, 3 EA-mf, 4 EA-ex, 5 CV-1, 6 CV-2, 7 CV-3, 8 CX. With the exception of sampling site CV-1 all sampling sites inside the Cueva del Azufre are completely dark. Barbasco is released annually between chamber V (CV) and chamber X (CX). Three sampling sites inside chamber V were defined (CV-1 to CV-3). Downstream of the exit of the Cueva del Azufre (EA-ex), a rather homogeneous mudflat (EA-mf) was sampled. Further sampling sites were a small non-sulfidic creek (Clear Creek; CC) and its confluence with El Azufre (EA-con). (C) Mean (±SE) densities of mollies at each sampling site. Letters above the error bars signify statistically different groups (Fisher’s LSD tests). (D) Size class compositions of mollies at the different sampling sites.

