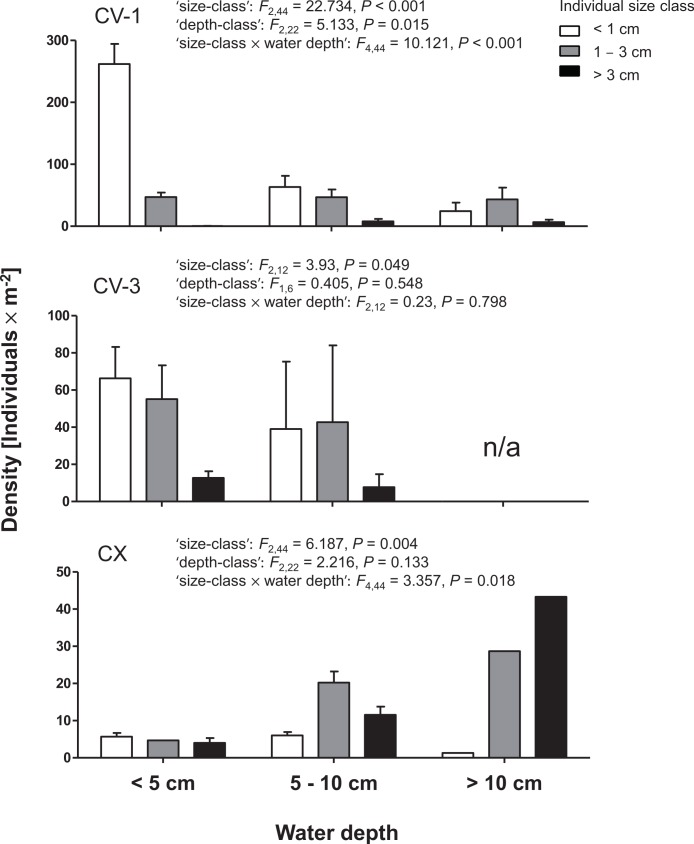
Figure 5. Population densities of cave mollies in the Cueva del Azufre.
Mean (± SE) densities of mollies, categorized in three size classes (<1 cm, white, 1–3 cm, gray, and >3 cm, black) in three water depths (<5 cm, 5–10 cm, and >10 cm). Results of rmGLMs are inserted. Note the different y-axis scales. Error bars are given if more than one sampling grid of a given depth class was present within the sampling site.

