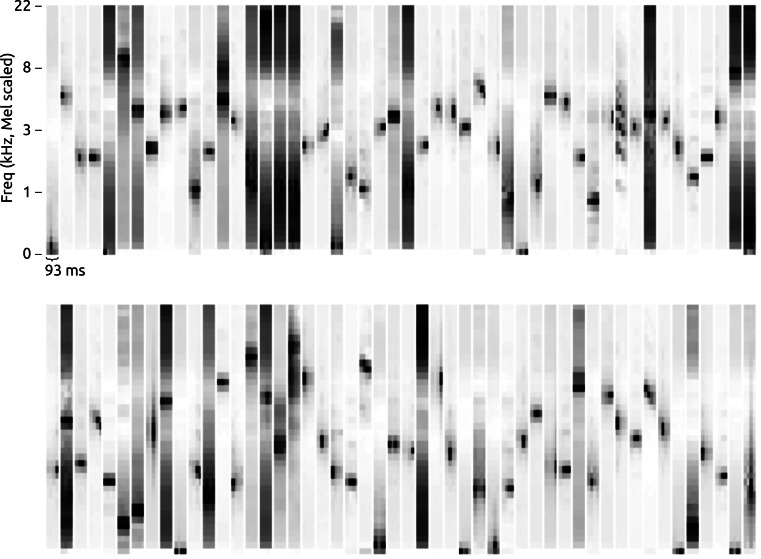
Figure 10. A random subset of the spectrotemporal bases estimated during one run of feature learning, in this case using 4 frames per base and the lifeclef2014 dataset.
Each base is visualised as a brief spectrogram excerpt, with dark indicating high values. The frequency axis is nonlinearly (Mel) scaled.

