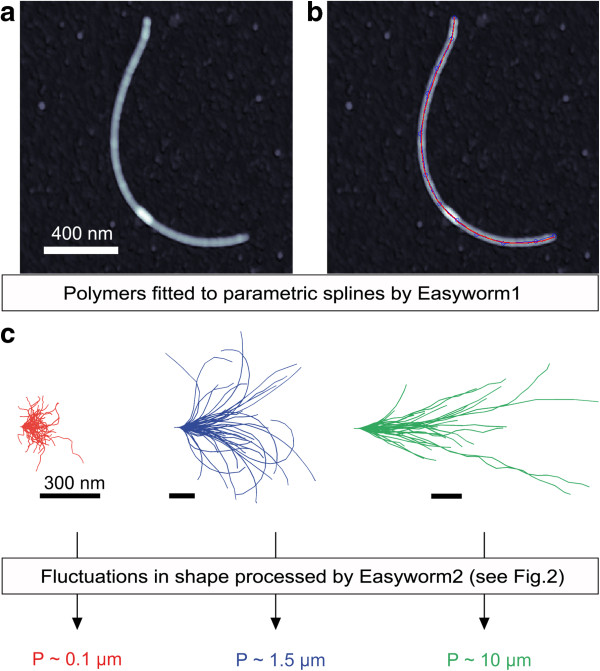
Figure 1.

Easyworm workflow. (a) Atomic force microscopy image of an amyloid fibril. (b) Same image as in (a), in which the contour of the fibril has been fitted to a parametric spline (red line; see Additional file 1: Note S1). (c) Three distinct amyloid fibril samples plotted with their initial tangents aligned to facilitate visualization. P is the persistence length of the fibrils, derived from the measures shown in Figure 2.
