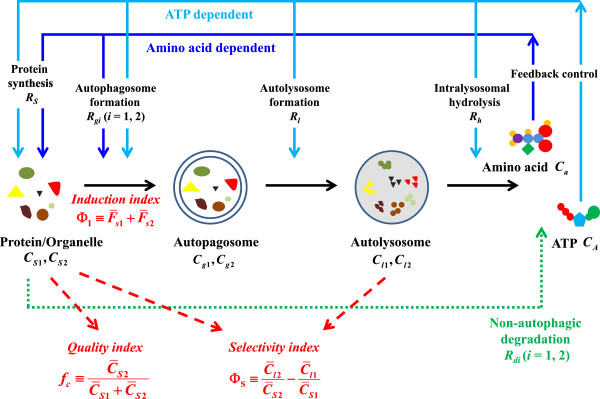
Figure 1.

Schematic representation of the model system and quantitative indices. The model assumes a three-compartment description of the autophagic process: protein/organelle, autophagosome, and autolysosome compartments. Solid and dotted arrows denote the autophagic feedback loops among the compartments and non-autophagic degradation, respectively. The autophagy-related rates, including protein/organelle synthesis RS(CA, Ca), autophagosome formation Rg1(CA, Ca) and Rg2(CA, Ca), autolysosome formation Rl(CA), intralysosomal hydrolysis Rh(CA), and non-autophagic degradation Rd1 and Rd2 are described in Appendix A. Dashed arrows indicate the quantitative indices fc, ΦS, and ΦI of protein/organelle quality, autophagy selectivity, and autophagy induction, respectively.
