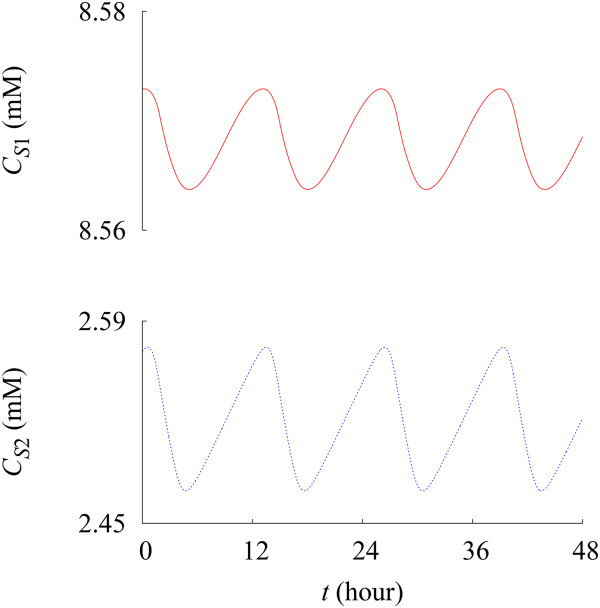
Figure 3.

Time evolution of the protein/organelle concentrations. Red solid and blue dotted lines describe the time evolution of the concentrations CS1 (top) and CS2 (bottom) of resident and abnormal proteins/organelles, respectively. Data have been obtained at and β = β(0).
