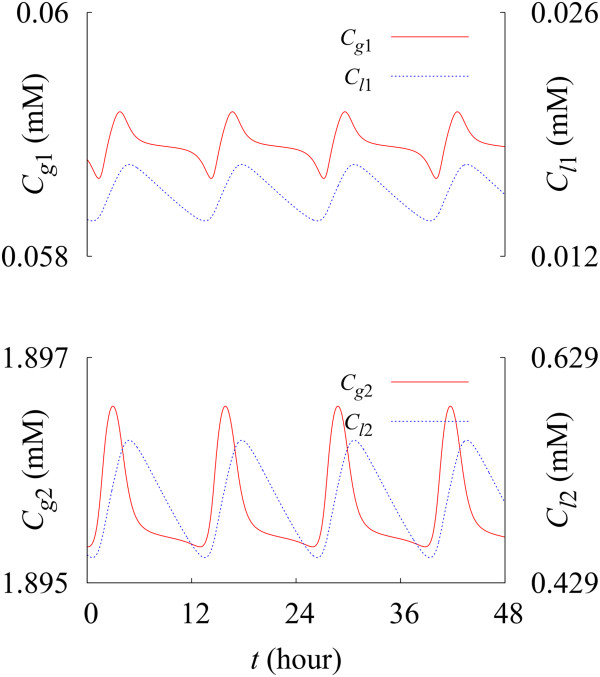
Figure 4.

Time evolution of the autophagosome and autolysosome concentrations. Red solid and blue dotted lines describe the time evolution of the autophagosome concentrations Cg1 and Cg2 and autolysosome concentrations Cl1 and Cl2, respectively, transformed from S1 (top panel) and from S2 (bottom panel). Data have been obtained under the condition and β = 0.2 %/h ≡ β(0).
