Figure 6.

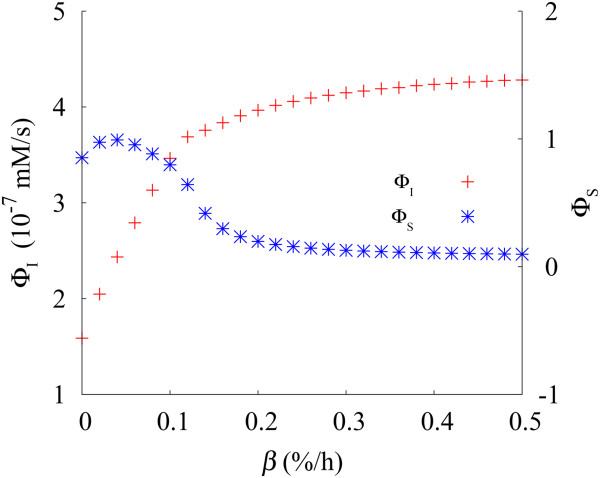
Autophagy induction index ΦI (red pluses) and selectivity index ΦS (blue asterisks) versus the specific deterioration rate β. Data have been obtained at with β varied up to 0.5 (%/h).

Autophagy induction index ΦI (red pluses) and selectivity index ΦS (blue asterisks) versus the specific deterioration rate β. Data have been obtained at with β varied up to 0.5 (%/h).